RECORDING the Hammond Organ
North Suburban HAMMOND ORGAN Service
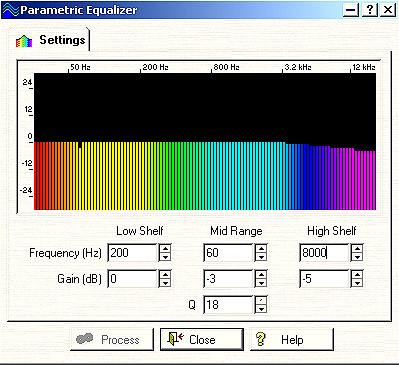
One important thing that we can easily do now with digital sound editing is to go after a particular frequency or pitch and make it louder or softer without affecting the rest of the program. This is particularly useful in eliminating background 60Hz AC power humming from a recording. The following picture is a look at the equalizer or EQ screen in a computerized digital sound editing program.

Figure 14. Lots of information here! This is a virtual parametric equalizer on a computerized audio editing program. The accompanying text has the full explanation.
Across the top in figure fourteen there is a scale that shows frequency. Below is a row of colored vertical lines. The boxes below labeled low shelf and high shelf correspond roughly to ordinary bass and treble controls on a stereo. However in addition to controlling whether they will increase or cut either bass or treble and by how much, they are also tunable. You can type in the frequency and also the amount of boost or cut you want to use at that particular frequency. The software then gradually makes the change which is indicated by the length of the vertical colored lines.
The center group of three boxes is very different from ordinary bass or treble controls. It allows you to go in and single out a particular frequency and make it either louder or softer without affecting anything else. The top box is the actual frequency in cycles per second. The center box is the amount of increase or decrease in dB, and the bottom box, labeled Q is how broad or narrow a frequency range you want the change to affect. The Q scale is in arbitrary units from 1 to 18.
In the picture Q is set to 18 which is a very narrow band and is good for making one particular pitch louder or quieter. In the picture, we are reducing the frequency of 60 Hz by three dB. This is sufficient to eliminate a minute trace of background 60 Hz power hum. Luckily, 60Hz is not a pitch that is found on the normal equally tempered scale where A = 440 Hz. however, it is just about halfway between the pitches of low A# and B. Therefore, although the setting above will target 60 Hz. it will have a slight effect on A# and B as well. This is why we’re reducing it by just 3 dB, so that the very slight reduction to the closest bass notes A# (58.3 Hz) and B (61.7 Hz. won’t be noticeable. In this capacity it is referred to as a notch filter, but there is no such thing as an absolutely perfect notch filter, so we need to be aware that in going after a particular frequency, we can still have a slight influence in musical tones that are very close.
This notch filter approach, however is very useful for correcting irregular bass in a recording that was made using microphones and where the standing wave patterns in the room or hall made some bass notes too loud or too soft. All that we have to do is determine which actual notes need correction, then look them up on a frequency chart, round off the numbers to the closest whole number, type that into the frequency box, set Q to 18, and then experiment with different dB settings while listening to the final result. Usually dB changes of less than five dB are sufficient.
If we use much lower numbers for Q, we’ll get a much broader range. If you have a recording, and the mid-range of the recording is weak, then you’d determine the middle of the frequency band you wish to correct, and try a Q of 1 which will spread the filter’s effect out to several octaves instead of one particular pitch.

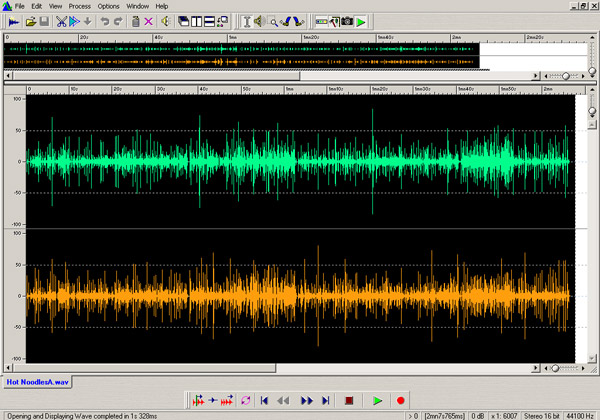
Figure 15. Graphical representation of a stereo recording of an entire song as displayed on a computer screen running a well-known audio editing software program.
If we have a graphical representation of an audio track, it’s possible to single out just a small part of the entire track. Figure fifteen shows a graphical representation of an audio track, and because this is happening in the final mixdown phase, the representation shows both the right and left channels together, even though we can do things to either one without affecting the other. In figure 15, we see the entire audio track. On the next page, we will look in closer to see just a portion of the track, and also zoom in close enough to see the details of the actual waveform of the track.
Back to Page 9. Page 10. Go to Page 11.