The HAMMOND ORGAN
North Suburban HAMMOND ORGAN Service
A gentleman by the name of John Hanert, who was one of Hammond’s principal design engineers, came up with an ingenious solution to this seemingly insurmountable problem by developing a system which modulated the frequency of the signals from the tone generator after they had already been produced, been combined into various tone colors and gone through the matching transformers! To accomplish all of this, Hanert first devised an electrical delay line which consisted essentially of a string of inductance coils in series with a parallel capacitor to ground between each coil. Schematically, it looks like figure seventeen, below.
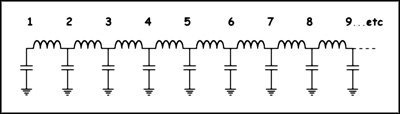
Figure 17. Elementary Hammond vibrato line box. See text below for its operation. This shows nine sections. Early Hammonds had 25 sections, later Hammonds accomplished the same result with eighteen sections.
At each successive line box tap, the identical signal appears, but it has been shifted slightly in phase behind that of the signal at the preceeding tap. No moving parts are involved with this phase shifting. This is based entirely upon the actions of the inductance coils and capacitors as the alternating current audio signal passes through them. It is also interesting to note that the frequency of each wave determines the amount of phase shift, which increases with an increase in frequency until the filter reaches its cut-off point. The values of the coils and capacitors are chosen so that the cut-off point is above the highest frequency that the Hammond organ produces.
Whenever an AC audio signal is applied at the input of this device (point one), the phase of the signal gets slightly retarded at each successive point or “tap” on the line (points two, three, four, etc.) Figure eighteen shows what this phase retarding looks like.
Hanert also knew that if the phase of an audio signal changes gradually over time, there will be a frequency change accompanying that phase change. So what Hanert next had to do was to figure out a way of sequentially “scanning” the delay line so that he could successively pick up signals which had been phase-shifted by varying amounts from each tap. Then the resulting continuous phase change would equal a frequency or pitch shift which is what he needed. In doing the above, the end result would be a slight lowering of the instantaneous frequency of the resulting audio signal.
But true vibrato also requires that the frequency of the signal gets increased by the same amount for each complete cycle of vibrato so that over time, the average frequency of the audio signal remains unchanged. Therefore, he also had to scan the vibrato line taps in reverse order after first scanning them forwards, starting with the far end and returning to the beginning.
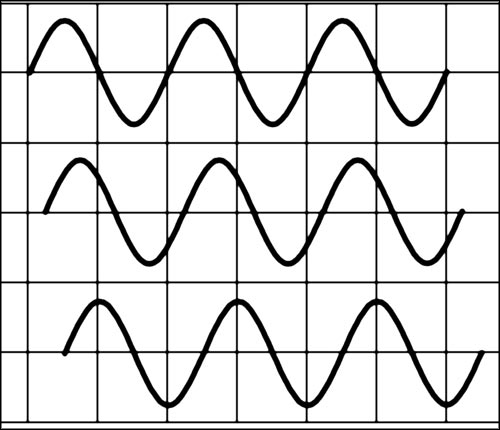
Figure 18, Top. This diagram illustrates phase shifting. The first signal represents the input to the line box. 18, Center.This second signal is an exact replica of the original but it has been shifted slightly behind the first wave. 18, bottom.The third wave again is a replica of the original but it has been shifted slightly behind the second.
If you sequentially pick signals from each tap individually, the end result is a continuous phase change (in this case phase lagging) of the signal. Here we are really looking at an electrical Doppler effect. When you have relative motion between a sound source and a listener, as the listener moves away from the sound source, he hears a pitch that is lower than the actual pitch because he successively encounters soundwaves that are phase retarded. (Relatively).
Previous page Page 9. Next page